
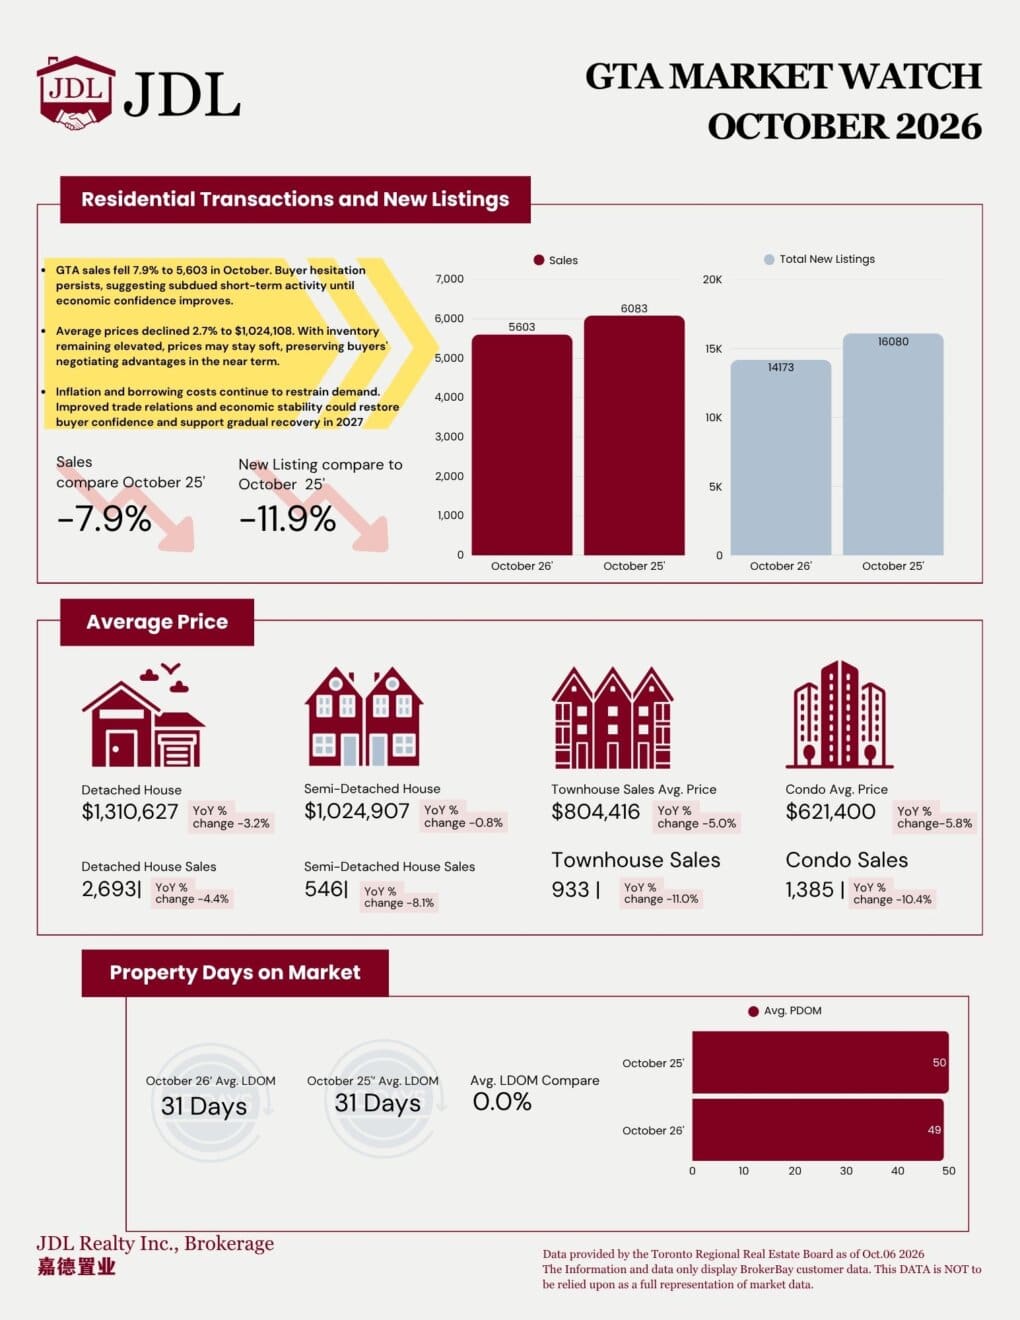
The GTA real estate market remained relatively cautious in October 2026, with both sales and new listings lower than the same period last year.
According to the latest market data, 5,603 homes were sold across the GTA in October, down 7.9% year-over-year.
At the same time, 14,173 new listings entered the market, representing an 11.9% decline compared with October 2025.
With new listings falling faster than sales, the amount of new inventory entering the market was lower than a year ago.
GTA Average Home Price
The average GTA selling price in October was:
$1,024,108
This represents a 2.7% year-over-year decline.
The MLS® Home Price Index Composite benchmark was also down 4.3% compared with October 2025.
Prices therefore remained below last year’s levels, although the size of the change varied considerably depending on property type.
Detached Homes
Average Price: $1,310,627
Year-over-Year Price Change: -3.2%
Sales: 2,693
Year-over-Year Sales Change: -4.4%
Detached homes continued to account for the largest share of GTA transactions in October.
Prices were lower than a year ago, while sales activity also declined moderately.
Semi-Detached Homes
Average Price: $1,024,907
Year-over-Year Price Change: -0.8%
Sales: 546
Year-over-Year Sales Change: -8.1%
Semi-detached homes recorded the smallest year-over-year price decline among the major property categories.
The average selling price remained relatively close to October 2025 levels, although transaction volume was lower.
Townhouses
Average Price: $804,416
Year-over-Year Price Change: -5.0%
Sales: 933
Year-over-Year Sales Change: -11.0%
Townhouses experienced a larger adjustment in both price and transaction activity.
The average townhouse selling price fell 5.0%, while sales were down 11.0% from a year earlier.
Condominiums
Average Price: $621,400
Year-over-Year Price Change: -5.8%
Sales: 1,385
Year-over-Year Sales Change: -10.4%
The condo segment recorded the largest year-over-year price decline among the four major property types shown in the October Market Watch.
Condo sales were also down more than 10% from October 2025.
For buyers looking at the condo market, individual buildings, maintenance fees, unit condition and neighbourhood-level pricing can still vary significantly even within the same overall market.
How Long Are Homes Taking to Sell?
The average Listing Days on Market (LDOM) remained:
31 days
That was unchanged from October 2025.
Average Property Days on Market (PDOM) was approximately:
49 days
compared with 50 days a year earlier.
This suggests that while transaction volumes are lower than last year, the amount of time required to sell a property has remained relatively stable overall.
October 2026 GTA Market at a Glance
Home Sales: 5,603 | -7.9% YoY
New Listings: 14,173 | -11.9% YoY
Average Selling Price: $1,024,108 | -2.7% YoY
Detached Average: $1,310,627 | -3.2%
Semi-Detached Average: $1,024,907 | -0.8%
Townhouse Average: $804,416 | -5.0%
Condo Average: $621,400 | -5.8%
Average Listing Days on Market: 31 days
What Does the October Market Show?
October’s numbers point to a GTA market where activity remains below last year’s level, but the slowdown is affecting different property types differently.
Semi-detached prices were relatively stable compared with last year, while townhouses and condominiums experienced larger price declines.
At the same time, both sales and new listings were lower year-over-year, and average selling times remained close to last year’s levels.
GTA-wide averages provide a useful overview, but conditions can vary significantly by neighbourhood, property type and price range.
Source: TRREB

Your Industry Experts
We’re here to help. Whether you’re an agent or a client, we have the support and expertise you need to thrive in your next endeavour.