


The Toronto Regional Real Estate Board’s July 2026 market data paints an interesting picture of the Greater Toronto Area (GTA) housing market. While headlines may suggest that the market has changed very little compared to last year, a closer look reveals several important trends that buyers, sellers, and investors should pay attention to.
Sales remained relatively stable, inventory tightened significantly, and prices continued to show signs of stabilization. Combined with expectations of lower interest rates and improving economic conditions, the market may be entering a new phase as we move toward the busy fall season.
So, what do these numbers really mean?
Sales Remained Stable Despite Market Uncertainty
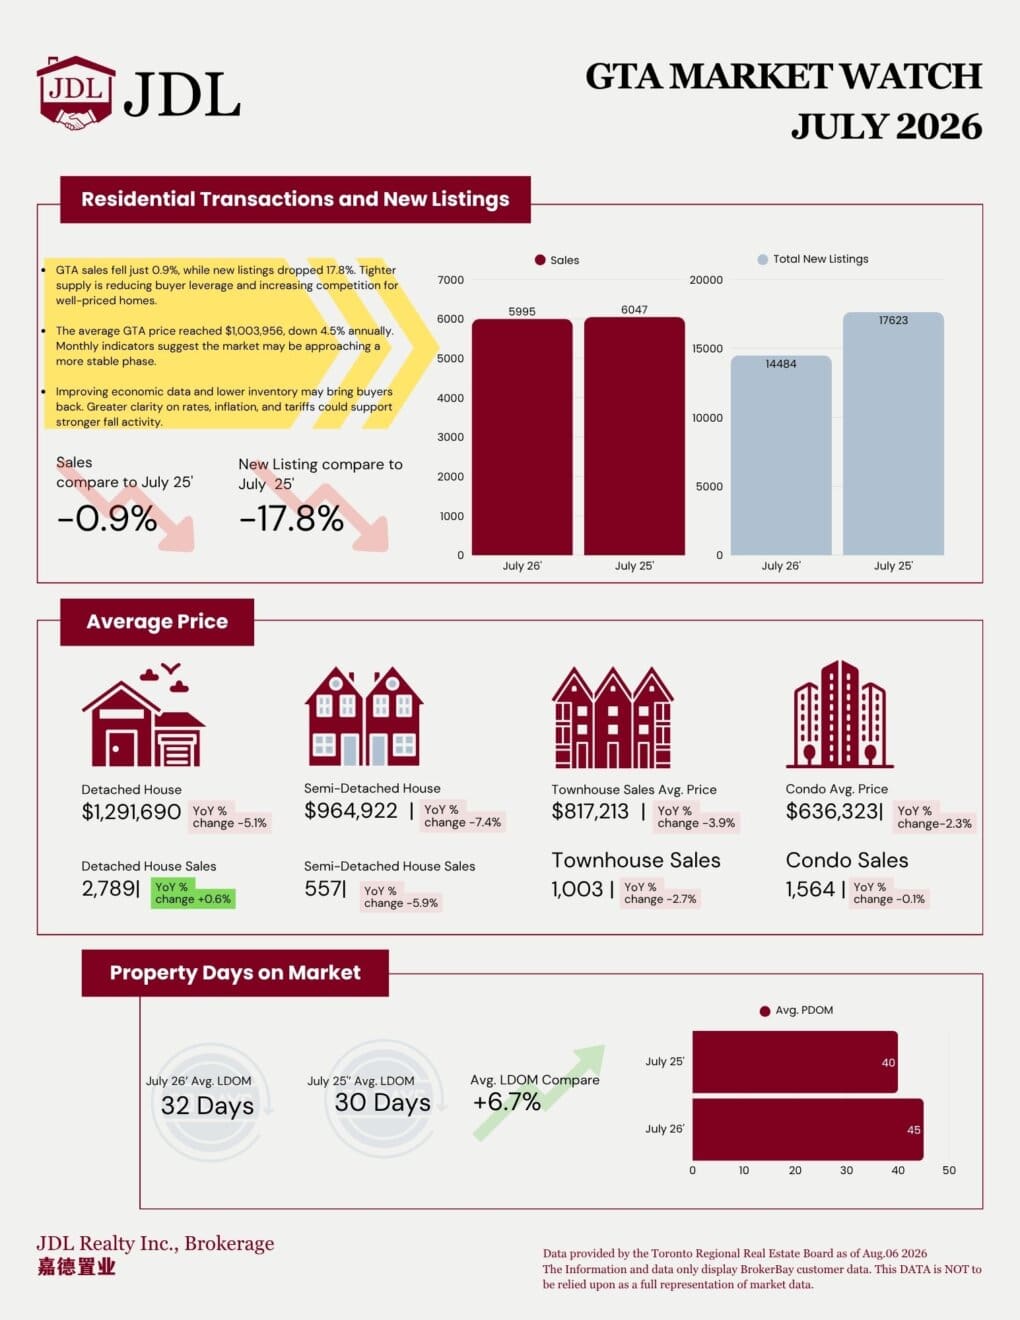
In July 2026, there were 5,995 residential sales across the GTA, compared to 6,047 sales in July 2025—a decline of just 0.9%.
While sales activity remained relatively unchanged, this suggests that buyers are continuing to purchase homes despite ongoing affordability concerns and economic uncertainty.
Instead of a sharp slowdown, the market appears to be finding a more balanced pace.
New Listings Dropped Nearly 18%
One of the biggest changes this month was the significant decline in new listings.
Compared to July last year, new listings fell by 17.8%, from 17,623 to 14,484 properties.
Why does this matter?
Fewer homes on the market means buyers have fewer options. If buyer demand begins to increase later this year—particularly if borrowing costs continue to improve—reduced inventory could lead to stronger competition for well-priced properties.
For sellers, limited inventory can also create favourable conditions, particularly in desirable neighbourhoods.
Home Prices Continue to Stabilize
The average GTA home price in July was $1,003,956, representing a 4.5% decrease compared to last year.
However, price trends vary across different property types.
Detached Homes
- Average Price: $1,291,690
- Year-over-Year Change: -5.1%
- Sales: 2,789 (+0.6%)
Detached homes remained the strongest-performing property type in terms of sales activity, suggesting demand for larger family homes continues despite higher borrowing costs.
Semi-Detached Homes
- Average Price: $964,922
- Year-over-Year Change: -7.4%
- Sales: 557 (-5.9%)
Semi-detached homes experienced the largest annual price decline among the four major housing categories.
Townhouses
- Average Price: $817,213
- Year-over-Year Change: -3.9%
- Sales: 1,003 (-2.7%)
Townhouses continue to offer buyers an attractive balance between affordability and living space.
Condominiums
- Average Price: $636,323
- Year-over-Year Change: -2.3%
- Sales: 1,564 (-0.1%)
Condo prices remained relatively stable, making this segment an attractive option for first-time buyers and investors looking to enter the market.
Homes Are Taking Slightly Longer to Sell
The average Days on Market (LDOM) increased from 30 days in July 2025 to 32 days in July 2026.
Meanwhile, Property Days on Market (PDOM) increased from 40 days to 45 days.
Although homes are taking slightly longer to sell, these numbers still represent a relatively healthy market.
For buyers, this means there may be more time to evaluate properties before making an offer.
For sellers, realistic pricing and strong marketing remain essential to attracting serious buyers.
What Does This Mean for Buyers?
Many buyers have been waiting for the “perfect” time to enter the market.
July’s data suggests opportunities still exist.
While prices remain below last year’s levels in most housing categories, inventory has also declined considerably.
If borrowing conditions continue to improve and more buyers return to the market this fall, today’s reduced competition may not last.
For many buyers, purchasing before demand accelerates could provide a strategic advantage.
What Does This Mean for Sellers?
Although average prices remain below last year’s levels, sellers may benefit from reduced inventory.
With nearly 18% fewer listings available, well-priced homes in desirable neighbourhoods continue to attract buyer attention.
Today’s market rewards sellers who price realistically, prepare their homes well, and understand local neighbourhood conditions rather than relying solely on GTA-wide averages.
What Should Investors Watch?
Investors should continue monitoring three key trends:
- Inventory levels
- Interest rate movements
- Population growth across the GTA
If financing becomes more affordable while housing supply remains limited, competition for quality investment properties could strengthen in the coming months.
Neighbourhood selection remains just as important as market timing.
JDL Realty’s Perspective
July’s market numbers suggest the GTA housing market is becoming more balanced rather than overheated or declining sharply.
Sales have remained stable, inventory has tightened, and prices appear to be stabilizing across most housing types.
As we move toward the traditionally active fall market, buyers may want to take advantage of today’s selection before competition increases, while sellers may benefit from listing into a market with fewer competing properties.
Rather than focusing solely on headlines or average prices, understanding what’s happening in your local neighbourhood remains the key to making informed real estate decisions.
At JDL Realty, we provide clients with neighbourhood-specific market insights to help buyers, sellers, and investors make confident decisions in every market condition.
Source: TRREB

Your Industry Experts
We’re here to help. Whether you’re an agent or a client, we have the support and expertise you need to thrive in your next endeavour.